Features
The Analyze Airport view lets you analyze a single airport's historical weather trends. The Compare Airports view lets you compare two airports side-by-side. Both views display all available weather plots for the airport(s) you selected.
The homepage showcases examples of our available weather plots. They include:
| Fractional bar stack by month | Heatmap by month/hour | Wind Rose | Histogram | Text | |
|---|---|---|---|---|---|
| Flight Categories | |||||
| Composite (both Ceiling and Visibility) | ✅ | ✅ | |||
| Ceiling only | ✅ | ✅ | |||
| Visibility only | ✅ | ✅ | |||
| Ceiling | ✅ | ||||
| Visibility | ✅ | ||||
| Temperatures | |||||
| Temperature | ✅ | ||||
| Feels Like | ✅ | ||||
| ISA Deviation | ✅ | ||||
| Altitudes | |||||
| Density Altitude | ✅ | ||||
| Freezing Altitude | ✅ | ||||
| Lifting Condensation Altitude | ✅ | ||||
| Precipitation and Humidity | |||||
| Hourly Precipitation | ✅ | ||||
| Thunderstorm Probability | ✅ | ||||
| Relative Humidity | ✅ | ||||
| Wind | |||||
| Wind Direction | ✅ | ✅ | |||
| Headwind and Crosswind | |||||
| Best Headwind | ✅ | ||||
| Least Crosswind | ✅ | ||||
| Wind Speeds | |||||
| Without Gust | ✅ | ✅ | |||
| With Gust | ✅ | ✅ | |||
| Gust Factor | ✅ | ✅ | |||
| Airport Info | ✅ |
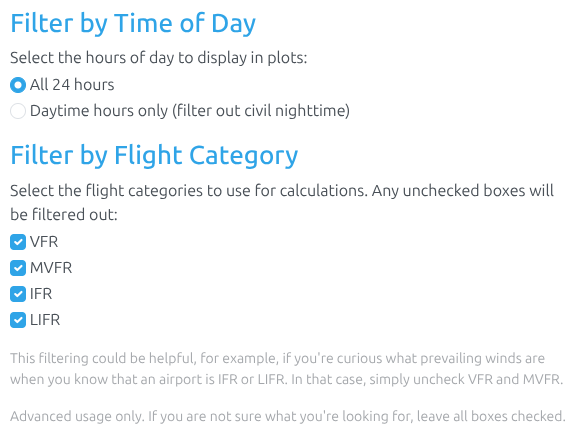
Pro subscribers gain access to custom filtering for the weather data that is represented in the plots. For example:
Sign up for free to get started.